
 Online Supplement for
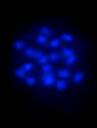
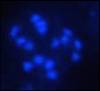
Metaphase chromosomes stained with the fluorochrome DAPI and detected by fluorescence microscopy reporting on the total chromosome number. Pistils were used as plant material.
| Tetraploid (4n=20) |
Triploid (3n=15) |
Trisomic (2n=10+1) |
|---|---|---|
 |
 |
 |
In conjunction with the pictures shown in the next section, tetraploids, triploids and trisomics are easily classified by the different number of blue spots.
| Tetraploid (4n=20) | Triploid (3n=15) | Trisomic (2n=10+1) |
|---|---|---|
 |
 |
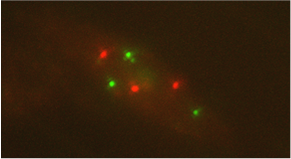 |
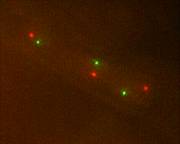
Interphase nuclei in root cells showing decondensed chromosomes as detected by fluorescence microscopy. Red and green dots mark the transgene insertion sites which are both located on chromosome 5. Dot numbers thus report on the actual copy numbers of chromosome 5 in the examined Arabidopsis thaliana plants.
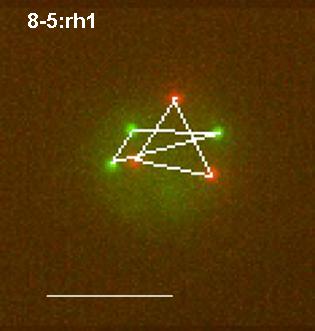
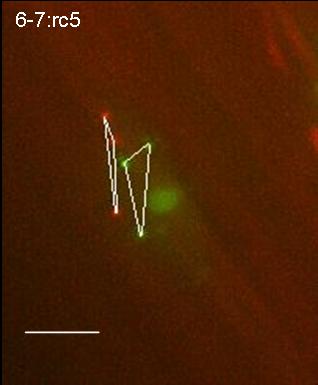
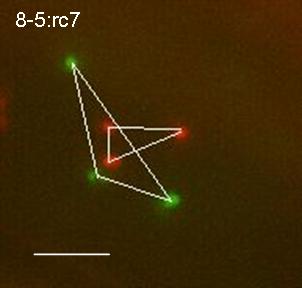
Examples of connected YFP and DsRed dots for measurements of distances in three-dimensions.
 |
 |
 |
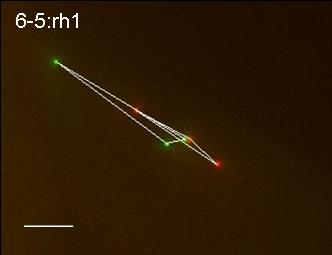 |
The photographs show maximum projections (all stacks were collapsed into one plane). The bar indicates 5µm. The labelling denotes the plant tested. Triploids (3n=15) are on the left (plant 8-5); trisomics (2n=10+1) on the right (plants 6-5 and 6-7).
![]()
![]()